Forex Trading
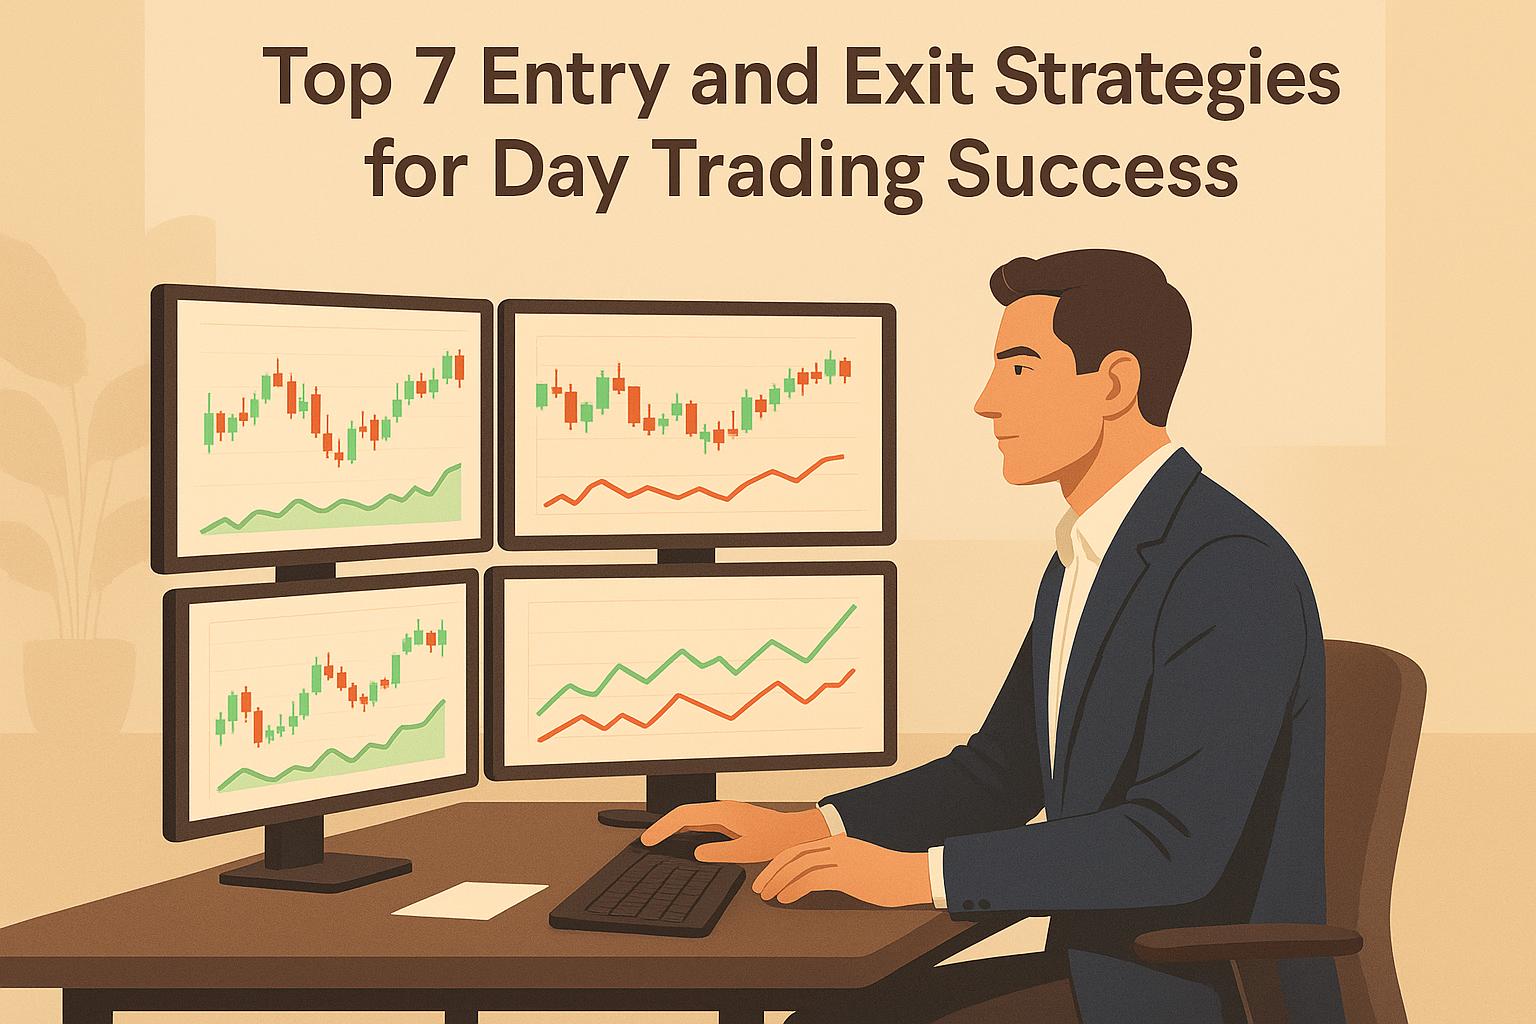
Top 7 Entry and Exit Strategies for Day Trading Success
Apr 30, 2025
Learn essential entry and exit strategies to improve your day trading success and manage risks effectively with expert insights.
97% of day traders lose money after 300 days. Why? Poor entry and exit strategies. But with the right tools and discipline, you can flip the odds in your favor.
Here’s a quick rundown of the 7 essential strategies to improve your day trading game:
Set Price Targets: Define profit and risk levels before trading. Use tools like the RSI and reward-to-risk ratios (2:1 or better).
Use Trailing Stops: Lock in profits dynamically as prices move in your favor.
Read Technical Signals: Combine multi-timeframe analysis with indicators to refine entry and exit points.
Plan Time-Based Exits: Stick to specific timeframes like scalping (1–15 minutes) or intraday (15 minutes–4 hours).
Trade Price Breakouts: Identify and act on sharp moves beyond support or resistance with volume confirmation.
Enter on Pullbacks: Buy during temporary reversals in a trend for better prices.
Set Stop Losses: Limit losses by placing stops at technical levels based on market conditions.
Quick Tip:
Use tools like the PulseWave Trading Indicator to simplify decision-making with clear entry/exit signals and multi-timeframe analysis.
These strategies aren’t just about making profits - they’re about managing risk and staying consistent. Ready to dive in? Let’s break each one down.
How I Enter & Exit Trades Like a PRO (boring, but it works)
1. Setting Price Targets
Accurate price targets are key to successful day trading. They help maintain discipline by clearly defining when to exit a trade for profit and how to manage risk through careful market analysis.
The PulseWave Trading Indicator is a tool designed to pinpoint entry and exit zones by analyzing historical price data. It aligns multiple timeframes to confirm target zones, offering a clearer picture of potential trading opportunities.
Here’s an example: On March 18, 2024, the Nasdaq-100 index opened at 11,500 points. A trader aiming for a 5% profit might set a target at 12,075 points. To limit risk, they could place a stop loss 3% below the entry at 11,155 points. This approach combines clear profit goals with risk management.
To make the most of your price targets:
Understand Market Context: Identify profit zones by studying support and resistance levels.
Use Risk-Reward Ratios: Aim for a reward-to-risk ratio of at least 2:1 for each trade.
Leverage RSI Signals: Use RSI values (70 for long positions, 30 for short positions) as indicators for when to exit.
Adapt to Market Changes: Adjust your targets as market conditions evolve, especially during periods of high volatility.
2. Using Trailing Stops
Trailing stops help lock in profits and protect gains during day trading. Unlike fixed stop losses, they adjust dynamically as the price moves in your favor, making them a flexible tool for managing trades.
The PulseWave Trading Indicator makes trailing stops even more effective by providing timely exit signals. This allows traders to ride extended trends while safeguarding their earnings.
Here’s how you can use trailing stops in your day trading:
Moving Average Method
For short-term trades, rely on the 8-day moving average (8MA) as your guide. Keep your position open as long as the price stays above (or below) the 8MA. For longer trends, switch to the 20MA, which accounts for wider price swings and helps capture bigger moves.
Two-Step Strategy
Wait for two bullish candles in a row, then set your stop loss just below the low of the previous candle. This approach protects profits while giving the price room to move.
"Money is only made on the exit not the entry and managing a trade exit strategy for maximum profits is one of the most important skills a trader can use to be profitable." - New Trader U
To get the most out of trailing stops:
Adjust the trailing distance to match market volatility
Use wider stops during periods of high volatility
Check multiple timeframes to ensure the trend is strong
The PulseWave Trading Indicator also offers a multi-timeframe alignment feature, helping traders avoid premature exits caused by normal market fluctuations. By sticking to a disciplined exit strategy, you can make the most of your trades and secure better results.
3. Reading Technical Signals
Technical signals are a key factor in deciding when to exit trades effectively. The PulseWave Trading Indicator offers reliable signals across various timeframes, helping traders make more confident decisions.
A crucial part of this process is understanding how different timeframes interact. One proven method is the top-down approach:
Higher Timeframe Analysis: Begin with larger timeframes to determine the market's overall direction. This step gives you a clearer picture of trends and helps identify major support and resistance levels.
Lower Timeframe Confirmation: Once the primary trend is clear, use 1-hour and 4-hour charts to fine-tune your exit points. For instance, if you're trading on a 15-minute chart, this approach ensures your decisions align with broader trends.
Here’s an example of how multi-timeframe analysis works:
Timeframe | Purpose | Signal Type |
|---|---|---|
Daily | Identify trend | Primary bias |
4-Hour | Spot key levels | Support/Resistance |
1-Hour | Refine timing | Entry/Exit points |
This method combines well with disciplined risk management, enabling more accurate trade exits. The PulseWave Trading Indicator simplifies this by delivering synchronized signals across timeframes. These signals work hand-in-hand with the indicator’s other features, ensuring a streamlined strategy.
To improve your results: keep an eye on higher timeframes for trend changes, confirm signals with broader market bias, and look for alignment across multiple indicators. The PulseWave Trading Indicator also highlights clear exit zones, helping traders stay focused even during volatile market swings.
4. Planning Time-Based Exits
Time-based exits help traders stick to their plans and avoid emotional decision-making. Similar to dynamic stops, they fine-tune how you manage trades.
The success of this approach depends on matching your holding period to your trading style. For day traders, this often means holding positions for minutes or a few hours. Here's a quick breakdown:
Approach | Holding Period |
|---|---|
Scalping | 1–15 minutes |
Intraday | 15 minutes–4 hours |
This method complements other exit strategies, creating a well-rounded plan.
How to Use Time-Based Exits
To make time-based exits work for you, focus on these steps:
Pre-Trade Planning: Set your profit targets and risk limits before entering the trade.
Price Movement Assessment: If the price moves quickly toward your target, use a trailing stop. For slower price advances, set a trailing stop once you've hit 75% of your risk/reward target.
"Many traders design strong exit strategies, but then don't follow through when the time comes to take action; the results can be devastating." - Investopedia
Markets can change throughout the day, and different sessions often behave differently. Staying adaptable is crucial. Tools like the PulseWave Trading Indicator can help by identifying session-specific trends, allowing for more accurate exit timing in various market conditions.
5. Trading Price Breakouts
Breakout trading is designed to take advantage of sharp price movements beyond key support or resistance levels. This method builds on earlier exit and technical signal strategies, offering a way to capitalize on volatile market conditions. It works well alongside other strategies by delivering actionable information in real time.
Identifying Valid Breakouts
The PulseWave Trading Indicator is a helpful tool for spotting breakout opportunities with high potential. Here’s what to look for:
Breakout Type | Features | Confirming Signals |
|---|---|---|
Horizontal | Price breaks a clear support or resistance level | Surge in volume, strong price momentum |
Trendline | Break occurs above or below a trendline | Alignment across multiple timeframes |
Continuation | Price breaks out of a consolidation phase | Clear directional movement |
Volume Confirmation
A spike in trading volume often signals market participation and supports the likelihood of a sustained breakout. The PulseWave Trading Indicator’s multi-timeframe analysis can help confirm these volume trends.
Managing Breakout Trades
When trading breakouts, keep these key aspects in mind:
Entry: Enter the trade after a clear breakout and a retest of the level.
Position Sizing: Adjust your position size to align with your risk management strategy.
Stop Placement: For long trades, set stops below the breakout level; for short trades, place them above the breakout level.
"Breakout patterns are one of the most powerful tools in a trader's arsenal." - Madhav Agarwal
Risk Management
While breakouts can lead to substantial profits, they also come with risks, including the possibility of fakeouts that can lead to quick losses of up to 5%. To manage this, use technical tools like ATR (Average True Range) and Bollinger Bands to measure volatility and fine-tune your trade timing. Balancing risk and reward is essential for long-term success in breakout trading.
6. Entering on Price Pullbacks
Trading during price pullbacks lets you step into positions at better prices during brief reversals within a larger trend. This method requires patience and precise timing to make the most of short-term market corrections.
Understanding Pullbacks
A pullback is a temporary price movement against the main trend, offering a chance to enter trades at more attractive levels. Key features of pullbacks include:
Pullback Feature | What to Look For | Why It Matters |
|---|---|---|
Candle Structure | Small bodies, mixed colors | Shows a brief pause in momentum |
Price Action | Movement against the trend | Signals a short-term reversal |
Volume Profile | Lower trading volume | Indicates the correction may be temporary |
Pattern Type | Simple or complex | Helps determine the timing of entry |
Using PulseWave for Pullback Confirmation
The PulseWave Trading Indicator helps pinpoint entry points during pullbacks by aligning multiple timeframes. When paired with traditional support and resistance levels, it highlights clear entry zones and confirms the market's direction. Use these signals to time your trades more effectively.
Entry Timing Strategies
Trend Confirmation: Use PulseWave to confirm the overall trend direction before entering a pullback trade.
Support and Resistance: Focus on pullbacks near key support levels in uptrends, as these zones often provide strong entry points when paired with reversal signals.
Volume Analysis: Watch trading volume during the pullback. A spike in volume when the price rebounds indicates the trend is likely to continue.
"A pullback is a temporary reversal within an ongoing trend, where price briefly moves against the prevailing momentum. This creates an opportunity to enter trades at a more favorable price before the trend resumes - core to any pullback trading strategy." - Mind Math Money
Risk Management Guidelines
Use a stop-loss just below the identified support level or recent low to limit potential losses.
Wait for clear reversal signals before entering to avoid jumping in too early.
Pullback trading requires discipline and a well-thought-out plan. By combining the insights from the PulseWave Trading Indicator with careful risk management, you can take advantage of these short-term reversals while keeping your risk-reward balance in check.
7. Setting Stop Losses
Stop losses are essential for managing risk and safeguarding your trading capital. To set them effectively, place stops at technical levels where a breach would invalidate your trade idea. The PulseWave Trading Indicator simplifies this process by identifying exit zones, offering clear guidance for stop placement.
Market Condition | Stop Loss Placement | Explanation |
|---|---|---|
High Volatility | Below major support/resistance levels | Accounts for larger price swings |
Low Volatility | Closer to the entry price | Focuses on precision and tight control |
Trending Market | Below previous swing lows or above highs | Aligns with the trend's structure |
Range-Bound Market | Outside range boundaries | Avoids being stopped out prematurely |
Adjusting Stops in Real Time
The PulseWave Trading Indicator allows you to adjust stop losses dynamically using its exit zone analysis. This ensures you can manage risk effectively while staying aligned with your trade goals.
"I know where I'm getting out before I get in. Whenever I enter a position, I have a predetermined stop. That is the only way I can sleep." - Bruce Kovner
Key Stop Loss Guidelines
Risk Assessment
Determine the maximum amount you're willing to lose and adjust your position size accordingly.
Technical Analysis
Use significant technical levels to set stops. Adjust for market conditions by incorporating tools like the Average True Range (ATR). Examples include:
Breaks of key trend lines
The previous candle's high or low
Breaches of important moving averages
Mistakes to Avoid with Stop Losses
Widening your stop after it's set
Placing stops too close to your entry, leading to unnecessary exits
Letting emotions override technical analysis
Conclusion
Mastering day trading requires effective entry and exit strategies paired with solid market analysis. The PulseWave Trading Indicator supports these seven strategies by offering confirmation signals and clearly defined entry and exit zones, helping traders make better-informed decisions.
Strategy Integration
These strategies work together with the methods discussed earlier. Success comes from combining multiple confirmation signals to strengthen decision-making.
Strategy Component | PulseWave Support | Advantage |
|---|---|---|
Entry Signals | Validates signals | Reduces false starts |
Exit Points | Precise timing | Optimizes profit potential |
Stop Losses | Confirms levels | Enhances risk control |
Breakouts | Aligns with trends | Validates strong moves |
Building Consistency
"Consistency in trading is a result of adopting a disciplined and structured approach to the markets." - UC Trading Coach
To get the most out of these strategies:
Create a Clear Trading Plan
Write down your entry/exit rules and risk limits. Include daily profit goals and acceptable loss thresholds.
Keep Detailed Trading Records
Track how your strategies perform, note market conditions, and reflect on your emotional responses during trades.
Review Strategies Regularly
Evaluate win rates, look for areas of improvement, and adapt to changing market conditions.
This structured approach supports the disciplined trading techniques covered earlier, helping to build a reliable trading framework.
Final Considerations
The PulseWave Trading Indicator enhances traditional day trading strategies by confirming decisions with clear market signals. Successful day trading depends on consistently applying strategies that fit your style and risk tolerance. Combining these proven methods with the PulseWave Trading Indicator creates a strong foundation for long-term success.
FAQs
How can I use the PulseWave Trading Indicator to enhance my day trading strategies?
The PulseWave Trading Indicator is a powerful tool designed to help day traders refine their entry and exit strategies. By analyzing market trends and identifying key price levels, it provides actionable insights that can improve your timing and decision-making.
To get the most out of the indicator, focus on its ability to highlight potential breakout opportunities and optimal pullback entries. Pair this with trailing stop exits to lock in profits while minimizing risk. Consistently reviewing the indicator's signals alongside your trading plan can help you make more informed and confident trades.
What are the most common stop-loss mistakes traders make, and how can they avoid them?
One common mistake traders make with stop losses is placing them too close to the entry point, which can lead to trades being prematurely closed due to normal price fluctuations. On the other hand, setting stop losses too far away can result in unnecessarily large losses. Another frequent error is basing stop-loss levels on arbitrary amounts, like a fixed dollar value, instead of using technical analysis or market conditions. Additionally, placing stops directly at key support or resistance levels can be risky, as prices often test and briefly break these areas before reversing.
To avoid these pitfalls, consider market volatility when setting stops. Tools like the Average True Range (ATR) can help guide placement. Use technical analysis to identify support and resistance levels, but position your stop a bit beyond these zones to allow for minor price movements. Finally, always define your risk tolerance and position size before setting your stop-loss levels to ensure they align with your overall trading strategy.
How does analyzing multiple timeframes improve day trading decisions and help interpret technical signals?
Analyzing multiple timeframes improves decision-making in day trading by offering a broader perspective on market trends and price movements. By examining long-term, medium-term, and short-term charts, traders can better identify key trends, spot potential reversals, and time their entries and exits more effectively.
This approach also enhances the accuracy of technical signals by confirming patterns or setups across different timeframes, reducing the chances of acting on false signals. Incorporating multi-timeframe analysis into your strategy can lead to more informed and confident trading decisions.
Related posts
Disclaimer:
This site is NOT a part of the Facebook website or Facebook Inc.
This site is NOT endorsed by Facebook in any way. FACEBOOK is a trademark of FACEBOOK, Inc.
Earnings Disclaimer:
We don’t believe in get-rich-quick programs or short cuts. We believe in hard work, adding value and serving others. That’s what our programs and information we share are designed to help you do. As stated by law, we can not and do not make any guarantees about your own ability to get results or earn any money with our ideas, information, programs or strategies. We don’t know you and, besides, your results in life are up to you. Agreed? We’re here to help by giving you our greatest strategies to move you forward, faster. However, nothing on this page or any of our websites or emails is a promise or guarantee of future earnings. Any financial numbers referenced here, or on any of our sites or emails, are simply estimates or projections or past results, and should not be considered exact, actual or as a promise of potential earnings – all numbers are illustrative only.
Results may vary and testimonials are not claimed to represent typical results. All testimonials are real. These results are meant as a showcase of what the best, most motivated and driven clients have done and should not be taken as average or typical results.
You should perform your own due diligence and use your own best judgment prior to making any investment decision pertaining to your business. By virtue of visiting this site or interacting with any portion of this site, you agree that you’re fully responsible for the investments you make and any outcomes that may result.